Friends don’t let friends flood the dorm for their thesis …

From the moment Jon Froehlich and I decided it would be a good idea to use washing machines as a mechanism to judge the relative effect of proximity of a message to the ability to act, a major issue was the possibility of catastrophic failure resulting in a leak.

The first generation of flowmeter-fitting kits, using rigid brass fittings to connect the meter to the washing machine and intake hose, had two major problems: leaks from the fitting-meter interface and the possibility of breaking the acrylic meter housing. The Koolance INS-FM17N flowmeter has nominally ¼” BSP threads, but in actuality, the threads are slightly larger in diameter, not properly fitting with the Swagelok fittings. I attempted to use Loctite 575 thread sealant to remedy this problem, but it was unable to seal the gap and lock the threads because of the large clearance, necessitating the use of matching Koolance BSP fittings with gasket. This had the benefit of also switching from a rigid connection with excessive length to a setup with flexible hose on both sides of the flowmeter. In assembling and testing the rigid connections, I broke a few meters (at $20/each), cracking the acrylic body.

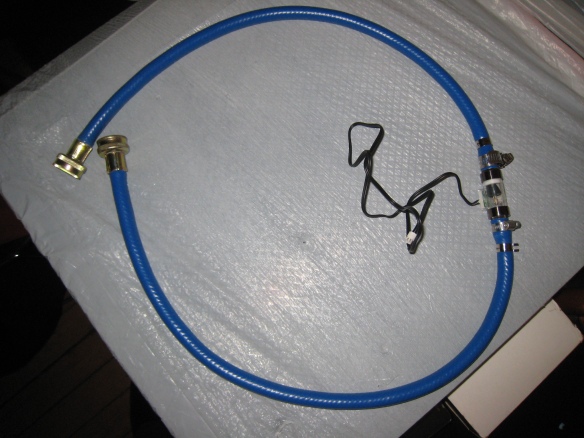
Assembled with 2′ of flexible hose on either side, the problem of torque cracking the body seemed to be resolved, and rated to 70°C (158°F) and 85PSI, the application seemed to be within the failure limits.

high-temperature washing machine hose with Koolance INS-FM17N flowmeter

Hose and flow meter assembly

Still, I was worried about the possibility of something springing a leak, and every time I went to download the data, I checked everything for leaks.

And one day I came upon a cloud of steam rising from behind a set of washers in Carlyle, and saw water dripping from a rag draped over a meter. Removing the rag I got a jet of hot water shooting up in my face. I quickly closed the valve and replaced the meter. It had cracked along the long axis, I’m unsure of how the crack started, whether it was somehow damaged or if there was a defect in the plastic (a small bubble could be the nucleation site).

About a week later, I found a meter with one of the ends slightly dislodged—it was not leaking, but looked as though the end was going to fail. I replaced that meter, with the final spare, and went to California for the Ebay Data Visualization Expo. Upon return, I found one of the meters had failed in the same way, presumably with the end blowing off and water shooting everywhere. Someone fortunately found it, closed the valve and left the ends dangling. I replaced the meter, and inspected the others, but the possibility of catastrophic failure is really disturbing.

Independent of the fact that in one of the other Carlyle laundry rooms (C1) there was a long-term leak from an outflow hose, and some of the machines leak internally, leaks are totally unacceptable, especially a 3/8″ hose shooting hot water everywhere!

Koolance wants the units back for analysis, and to give me a refund for the price of the replacements, but it’s still disturbing to worry about failure and finding myself in hot water with the administration. So far there has not been a frantic call from facilities, but it’s a worrying thought.

Initial Deployment and teething troubles

Five of the six metering systems are installed – one of the laundry rooms is closed for the summer, so next week Hercules will come to move that system to another building.

But there is another problem, one more critical: bad data. The system installed and let run for a month in Goddard seems to have about a thousand good data points. Seems is the operative word there, as the software doesn’t tell you if it screwed up. Now that there’s error checking, I know something is going wrong, but all I get is errors-meaning the software isn’t working properly. I noticed that there is more complexity to the fill cycles than I thought (seemed simple enough, fill 5 times) although listening to the machine, it seemed to fill (defined by a stop in filling) more than 5 times, in a sort of ‘add some water then add some more mode’ which screws up the count. The way the system measures the cycle is to count how much water is added each time, and after a delay, count that fill cycle as complete—and after a full (two for top load, or five for front load) fills, write to the data file, indicating what temperature on the main wash fill was used. The problem becomes more difficult with the Super Cycle.

For $0.25 more, you can get an extra rinse and run the main wash longer. That sixth or third fill makes havoc for my system as it would think the next count started, thus screwing up a whole line of washes. To combat this problem I added the ability to listen for the sixth fill, not it in the data file, and therefore not kill the datafile column. And I added a rolling clear, which would clear any extraneous data if there is a cycle which ends early in the case of a power failure, someone taking their laundry out early, or a missed super cycle fill.

When simulated, everything worked out great. Once I put it in place, nothing seemed to work, either for the top or front load machines. Both detected lots of super cycles (which are rare, according to Lev, the Hercules technician, and has several resets. I have modified the timings but if the data is bad Tuesday, I’ll have to ‘listen’ to the machine more carefully and see if the software isn’t accurately measuring the cycle.

Another possible source of trouble is the wiring. Initially (and partly still) I had planned to use twisted pairs of cable. It’s simple and it’s cheap, but it doesn’t stick in the pins very well. Eric Rosenthal suggested using header pins and ribbon cable, which I’m trying but that is more susceptible to common-mode interference, which is rejected by twisted pairs. Eric recommended shielded TP cable to eliminate this possibility, but that stuff is nearly impossible to work with at scale (60 runs) and would set me back past my acceptable time limit—the unshielded twisted pair, especially with the header pins, seems to work well, if I run in to trouble there, I’ll have to make more runs of twisted pair cabling. It’s inelegant, but works, especially with the better-sticking header pins.

I can have the datalogger print out via serial communication what it’s listening to-therefore getting a handle on exactly what’s happening. If indeed the fill schedule isn’t as I think, I will have to revise the code, which is simple, provided the schedule is regular, or can be put into time blocks (multiple fills in a single time window are fine, and would be counted as one fill). Currently the software is set so that there’s a one minute timeout after filling for nothing to happen before it considers the fill cycle complete and increments the count, this may need to be adjusted.

A Multi-Scale Problem, In Your Living Room

The previous post, on the topic of how to wrap your head around a multi-scale problem, provides a general framework for conceiving of a problem on multiple scales, ranging from the individual button press to global policy. A convenient example of a multi-scale problem which is in nearly every living room is the cable box.

http://www.nytimes.com/2011/06/26/us/26cable.html

It seems innocuous enough, the cable, satellite, or telecom company rents it to you and it makes the telly gets a crisp HD signal. Sure it complicates the remote situation, and it adds a few bucks to the cable bill and the electric bill every month … wait, how much does it tack on to the electric bill? About 25-50W, continuously, 8760 hours a year, which adds up to about 200kWh/year, or at my rate of about 10c/kWh I pay about $2/month for the cable box electricity consumption (that’s a slightly more stinging $24/year, per box). Two of them consume as much electricity as the fridge! (which consumes an average of 415kWh/yr, or $45.65). And all it’s doing is … a lot.

What the cable box is not so silently doing

If it’s a DVR, it has a hard drive in it, which you can often hear spin up and hack away while recording, or at conveniently quiet times to defragment or update the guide. That uses energy. It also has a nice little clock, and a few LEDs to tell you it’s on or (still on but pretending to be) off. It never really turns off, and most don’t even throttle back a significant amount. The reasons it stays powered up all the time is that it has a lot of communicating to do, and people expect near instant action when they turn the TV and the box on.

It has to stay in contact with the cable office or satellite, and keep the channel and program listing synced up. It has to record when you want it to record (and therefore it needs to keep the hard drive defragmented (if you haven’t defragmented your computer’s drive lately, you should do that soon). It may have to do other things too—like get real time messages from upstream—some can be controlled from the web or from a smartphone application, or offer other features.

Why does it use so much electricity?

The quick answer is the most telling quote in the article: “Nobody asked us to use less.” Now, engineers shave grams off bike frames and milliwatts off the draw of cell phones, but without external pressure on multiple levels—from the government (105), on the corporation (103), to the boss (102), to the engineers (101) things won’t be prioritized. A cable box has to offer at least acceptable ergonomics, high reliability, and *instant performance*. People expect it to start instantly—and certainly not take an hour to update. If you’ve ever plugged in a factory fresh one, it can take up to an hour to set itself up—not exactly useful.

The system itself operates at multiple levels, which is why it has to stay booted (sort-of). The cable box (100) has to communicate with the local network (103), and possibly with a higher level network (104) or satellite network (106). That’s a little more complexity than just picking up the carrier wave from the local network affiliate and demodulating the Indian Head.

What to do

The engineers at Motorola or Cisco or Samsung (large manufacturers of set-top boxes all) need to work with the network designers to design more efficient ways to get the data to the box so that it doesn’t need to download so much data to get itself ready to go, and can power up and down as needed, such as waking on external signal or having a higher data rate to get its work done faster before powering back down. And of course better electronics can help to some degree.

One partial solution is to get rid of the cable box, and make the television smarter—modern TVs already have some equipment that’s always powered on—the remote receiver, possibly some other functionality—1..5W worth of something, which isn’t inconsequential when summed over the whole of the US. This would require a better solution than the failed CableCard, but something modular like that would be a start, eliminating a separate remote and batteries, power supply, cabling, box, and some circuitry.

There’s a behavioral component here as well—can you train users to expect a few second delay between button press and when the picture appears? That’s a fundamental human factors issue, fortunately people can put up with a few seconds of delay, although now being accustomed to instant action makes it harder to go to a less ‘perfect’ model of operation. The other part of the human dimension of this problem is that due to the delay in and diffuse nature of the feedback on power consumption (you get a single number at the end of a month), unless you read the Times or use an electric meter to figure out the STB is unobtrusively drawing a constant 25-50W, and then put that into context—and then get riled up enough to petition the government for redress.

Fortunately the EPA is extending the Energy Star guidelines to cover the set-top box, but that will take some time to come into force—and as consumers have almost no say over which box they get, the cable utility providers may not opt for newer higher efficiency units—it’s not their cost, so they don’t care other than wanting to be good corporate citizens.

What can you do, now?

You can try to see what happens if you power off the cable box with a power strip physical switch—some may resume quickly, some may take an hour. There’s going to be a lot of variability. And you can petition the government… or get rid of your cable/satellite service and read more books!

A Follow Up

Their estimate of 25 billion kWh of annual consumption, is incredible, especially if that results in 9 power plants worth of draw.   I’ve heard the figure bandied around of 5 power plants powering all of the devices which aren’t doing anything useful (like the charger not charging your cell-phone).  If it really is fourteen (14) power plants powering things which aren’t doing useful work, there’s a huge problem, and opportunity for electronics design and user education.

Ripples of 10

At DesignBoost New York, hosted by the Cooper-Hewitt National Design Museum, I met Professor Jamer Hunt, of Parsons’ Transdisciplinary Design Program. His presentation, using the frameworks of the Eames’ Powers of 10 video to contextualize the issues we face in terms of sustainability reinvigorated a line of thought I had been working on earlier this year relative to my thesis and provided a much better conceptual framework than my rather clumsy four-level taxonomy.

First, watch Powers of 10

Then read Prof. Hunt’s article in Fast Company (2010).

To realize a sustainable future, we need to work on all levels, from 100 to 107. Policy level (105 .. 107) directives work downward, affecting the way people do business, relate to the technology in their lives, and relate to each other. In order for those directives to have an impact, other than making people frustrated and angry, there needs to be an ability to act at lower levels (101 .. 104). The work that I’m doing on individual persuasion operates at the 10-2 to 103 scale—how can people be influenced in using the things they own, and how can the buying experience be shaped (for example, buying a more efficient, longer lasting appliance has a pronounced impact over its life).

A taxonomy of intervention levels

107        Planet-scale (the earth is just over 107 m3)

106        Trans-national Scale

105        National Scale

103 .. 104    City

102        Neighborhood

101         Purchasing Decisions (appliances)

100        Use of appliances

10-2 .. 10-1    individual user actions

Obviously these aren’t discrete categories, but guideposts on a continuum. The operative issue is that any sort of decision has to be evaluated in terms of its impact on multiple scales. A policy level (105) change, like Energy Star or Top Runner interfaces with 101 scale issues of buying consumer products, which in turn influences 102 scale issues of making and transporting products … and that influences higher level issues of energy delivery and the ripples keep expanding. Starting at the bottom, influencing actions, makes for ripple effects up to higher levels: reducing (or increasing) electrical loads via 10-2 or 10-1 scale interventions influence up to the 105 or 106 scale due to the size of the electrical grid: it’s a little switch which turns all the lights out.

How Bad are Bananas?

Apparently, they’re pretty good, both in terms of carbon intensity and of course taste. The book, How Bad Are Bananas is pretty good too, although its carbon intensity delivered from Texas A&M through interlibrary loan was a little high. The book quantifies the carbon impact of many common items and services, like the cell phone and the service (the service is more intensive than the device), and is conveniently organized by impact size. If Smoky the Bear’s admonition wasn’t enough, starting a bushfire (165Mt CO2e, Australian bushfires of 2008) (Berners-Lee, 2010, p. 162) is probably the worst thing you could do in greenhouse gas impact (unless you’re plotting a Dr. Strangelove Thermonuclear Apocalypse, >690Mt … but going all out is also likely to precipitate a nuclear winter) (Berners-Lee, 2010, p. 169).

There were some surprises:

  1. Being a vegetarian is better, but still not really that much lower in carbon intensity than being an omnivore.
    Being a vegan, as one would suspect, is much lower in intensity than vegetarian or omnivorous diets. Cheese takes a lot of milk, which takes a lot of feed. Eggs are derivative production (corn+soybeansàchickensàeggs) and there’s a lot of nitrogen released in the dung, which has its own impacts. Follow Michael Pollan’s advice: “eat food, not too much, mostly plants.”
    Rice has a disturbingly high impact, because of the flooding of the paddies. Considering the calories per unit land, it’s still a good crop, but rational policy balances the use of land (what can grow here) with carbon intensity and energy density (kcal/hectare).
  2. Trains aren’t that great, compared to buses.
    Trains are heavy. They’re overengineered to provide for a margin of safety well beyond that justified by the probability of accident (which is very very low). Trains are probably the safest way to travel—even without having a crashworthy train (considering the size and weight, it’s pretty hard to build a crashworthy train.
    Fortunately, they can be much faster, cutting into the need to travel by plane—so taking the TGV might be lower intensity than taking a flight.
  3. Natural products aren’t necessarily better.
    Leather is pretty intensive because it comes from cows. Leather shoes lose to Crocs. Cotton might grow on plants, but synthetics might be more eco-friendly in terms of carbon intensity, due to washing and drying—and how long the pants will last.

This is all very complex. Carbon isn’t the only metric, of course—toxic impact, human labor use, animal treatment … they all need to be quantified in the decision process. It’s hard to walk away from this book without wondering if you’re a Bad Person or actually not so bad in the scale of things. I suppose I have a relatively large impact, flying too much but not as much as others, being an omnivore, owning (but seldom using) a car (which has long paid off its embodied energy) …

The final takeaway is to not waste your money on carbon offsets—unless the utility is using your contribution to actually build more infrastructure, you’re being taken for a sucker (Berners-Lee, 2010, p. 58)

Delayed Feedback Makes for Difficult Troubleshooting


Looking at the first download of the washing machine usage data, I have found some problems: three of the five machines showed strange behavior: all hot or cold loads. That’s practically impossible and means something’s wrong.

Goddard Hall

5/11/2011 .. 5/17/2011


A

B

C

D

E

hot

0

17

23

0

85

cold

84

75

70

43

0

warm

0

15

10

0

0

Σ

84

107

103

43

85


There are several possibilities for things which would cause this kind of problem:

  1. Disconnected wire/broken wire or short
    This is easy to troubleshoot and fix. It is possible something came loose, and it would most handily explain the data error: if the hot wire
  2. Bad flowmeter
    without disconnecting the hose (hard to do), the flowmeter could either have an electrical fault or the meter wheel might not spin. Because I can’t easily run the machines, I can’t see what the problem is so easily. And this a difficult and/or expensive fix–I don’t have too many spares, the meters are $20 apiece, and the replacement requires some help from Hercules or the plumbing shop (due to liability issues).
  3. Hardware fault on the Arduino or Logshield
    I tested all of the Arduino+logshield dataloggers before deployment, and they passed testing for at least 24 hours of continuous use. It is possible that a fault developed, due to electrostatic discharge or other damage, but I think this is somewhat remote.
  4. Bad ground
    all of the flowmeters use a single ground plane—which would appear to work given that the problem is intermittent, but it could bear testing—some of the pins may have better connections than others. I’ll have to think about how to test this properly.
  5. Software fault
    The software should be good, considering the logging systems passed test. But I’ll rewrite the simulator to run through hot, warm, and cold loads to test the discriminator.

Lesson Learned

Building systems which don’t give real-time feedback are a problem (as one would expect) – getting all of the bugs out isn’t as easy as it should be, and this might be harder than it looks to perfect—which is the operative goal.

Datasurfer Surface Plot Tool

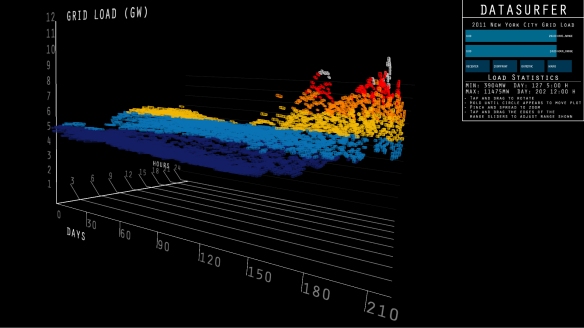
Corner View of surface plot

Datsurfer

Datasurfer is a four-dimensional surface plot developed in Processing, for Introduction to Computational Media.  Datasurfer takes a two-dimensional spreadsheet (CSV) and translates values into a 3D surface, which can be manipulated by moving the viewpoint, or by shrinking or growing a two-dimensional window (in the case of the NYISO Grid Data, hours of the day/days of the year) of which blocks are plotted.  Moving the viewpoint changes the apparent representation of the data, allowing for a wider set of conclusions to be made–in this case, it is easy to see that there is substantial variation in the load both over the course of the year, and over the course of the day.

Components

The processing sketch is based on a two-dimensional parsing algorithm from Jonathan Cousins and Nick Sears, and adapted with help from Zannah Marsh.  The interface buttons and sliders come from the spectacular plugin set ControlP5, and the 3-D manipulation is provided by PeasyCam (much easier than writing my own manipulation with the Processing Camera commands).  Of course, neither ControlP5 nor PeasyCam are perfect, but they do work quite well.  A special thanks is due to Andreas Schlegel, author of ControlP5, for modifying the library to allow for changing the slider edge width – right when I needed it at the Ebay Design Expo.

At the ITP show, this is being displayed on a giant touchscreen, which is really a lot of fun, but unfortunately is a little hard to manipulate due to being only single-touch.  Multitouch (which everyone loves on tablets, phones, and now laptops) is going to really extend the computing experience, much more than it has already.

Expansion

As a programmable interface, there is nearly infinite ability for customization of the tool to different datasets–half the work of information visualization is setting up the tool in such a way as to yield valid conclusions and minimize artifacts.  One of the goals of this project is to build a real-time interface for data from a feed, such as a Tweet-A-Watt.

Special Thanks

Thanks to Jonathan Cousins and Nick Sears for a great fall introduction to information visualization and the seed of this project (and the start of the code), Zannah Marsh for the opportunity (need) to develop this for ICM, the Processing community for developing great plugins (ControlP5, PeasyCam), and of course ITP (specifically George Agudow and Red Burns).

The Trials and Tribulations of Metering the Washing Machines

The initial idea was to use threaded fittings to interface the flowmeter with the washing machines. Fittings make sense, they are usually secure and won’t leak, provided the threads (A) fit together properly, and (B) are designed to seal. If that fails, there are ways to make poorly fitting threaded connectors seal, usually PTFE thread tape or anaerobic sealants.


Brass fitting assembly with residue of Loctite 574 on ¼ in. threads

The Koolance FM-17N flowmeter is threaded for ¼” female BSPP (British Straight thread Pipe Parallel, also known as DIN ISO 228-1). Being familiar with NPT (National Pipe Thread) which is a tapered or conical (self-sealing) design, I didn’t know how BSPP would work, until I tried it. I should have looked at the Koolance fittings more closely before committing to a large parts order of expensive ISO conversion (ISO/NPT) fittings from Swagelok, but I had perhaps too high expectations of Loctite thread sealant. The way ISO straight/BSPP fittings work is that they tighten against a gasket, rather than sealing the threads. The Koolance hose barbs and fittings are designed to work this way, but I didn’t quite understand how this worked, and therefore went with a faulty assumption that I needed to use a thread sealant/threadlocker. Alas, the tolerances of the Koolance fitttings are too wide, and the ISO fittings from Swagelok don’t fit—and of course never seal, even with the assistance of PTFE tape or Loctite 565 thread sealant. Note: the Koolance FM-17N has nominally 1/4 in. ISO straight threads.


Bosch Automotive Handbook: (Krickau & Nöcker, p. 318)

The way Loctite anaerobic sealants/threadlockers work is that they cure in the absence of oxygen, under pressure (such as in the tiny space between threads. A glob of it will stay a slightly sticky glob, but won’t really solidify the same way it will under pressure. This is especially important in applications where it is necessary to wash away the excess that gets squeezed out from between mated surfaces, such as in an engine (use Loctite 574 (the famous Loctite Orange) to put your Porsche case halves together—using RTV will cause your engine to destruct when bits of solidified RTV (silicone) clog the bearing oil passages). With rather large gaps between the threads of the fittings and ends of the flowmeter, the Loctite doesn’t quite cure, and therefore any disturbance causes the adhesive to shear from the surfaces and thus it starts to leak. The idea with Loctite thread lockers is that the shear strength keeps the threads mated.

To add to the slow leaks, the overall length of the assembly is rather long, and with an end rigidly attached to the hose bib or back of the washing machine, any torque causes the acrylic case of the flowmeter to crack—a catastrophic failure in my case. Flooding a dorm basement is not an option.

Ultimately the question is what cycle did the user select, or slightly more generally, what wash temperature did the user select. Without splicing into the water system, it may have been possible (and far cheaper) to use a set of thermocouples or thermistors on the intake hoses, but this relies on there being a substantial change in temperature to indicate what’s going on—and it may not be the case that the cold hose/pipe gets appreciably colder when the water flows through it, and the hot hose may stay warm (above threshold) in two immediate consecutive washes. It would take a bit of tuning to set thresholds, and this approach would have required a positive signal of when the machine is running (cycle start and end), which has been a little more of a challenge, using either an electret microphone to detect vibration or a Hall effect sensor on the power cable. Neither of those are fully foolproof, but fortunately the most positive system for measuring the cycles has been made workable and safe.

Installing the flowmeter in a segment of flexible hose solves the problem of putting stress on the acrylic meter body and cracking the meter, and using the Koolance gasketed BSPP fittings solves the problem of fittings not quite threading together and sealing. The flexible hose effectively prevents transmission of torque to the meter, provided the force is not excessive, and by using a hose clamp and slightly undersized inside-diameter hose, the possibility for leaks is minimized. To further reduce the possibility of leaks, the threads can be sealed with Loctite 574 thread sealant, providing a measure of resistance against the fittings unscrewing and sealing the threads ahead of the gasket integrated into the base of the hose barb.


Koolance hose barb with integrated polymer gasket


FM-17N installed in pressure-rated hose with hose clamps

Quantaproject: The Shake Out

It is fitting to describe the increase in the incidence of obesity and diabetes in the US as an epidemic. For most of human history, the problem has been solving the calorie problem—but now we are suffering on a mass scale from the opposite problem: a surfeit of calories, and ’empty calories’ at that.

Right now, the United States has an enormous public health crisis in the form of a large and rising proportion of the population classified as overweight, obese, and extremely obese. And the trend points to an increasing rate of obesity—and attendant health problems including diabetes type 2.

And it gets worse: the rate of obesity among young people is substantially greater than that of the population as a whole, it is forecast that up to 1/3 of today’s teenagers are at risk for developing diabetes type 2, and may lose 1/3 to 1 year of predicted gains in life expectancy, and a greater number of life-quality years (a year where they cut your toes off isn’t so happy).


How did we get here?

With regard to the need to increase the value of farm products during the Great Depression, subsidy programs were enacted to increase the income of farmers. In 1973, under the direction of Secretary of Agriculture Earl Butz, the paradigm changed to payment to support greater production. Paying to support production of commodity crops has led to (1) a shift towards larger farms, and (2) a decrease in the real cost of sugars, refined grains, cheese, and meat. While this could be considered beneficial in terms of delivering more calories per dollar, it has decreased the quality of the American diet, and undoubtedly contributed to the increase in obesity and diabetes.

Americans now spend less on food than at any time in history, but this decrease in expenditure on food comes at the loss of diet quality. Vegetables, fruit, and non-industrial foods are still rather expensive, and therefore make up less of our diet. The ultimate result of the decrease in food cost is that we eat more: restaurant and recipe portions have both increased in energy value and size, and it’s disturbingly true that we will eat what’s in front of us, see Brian Wansink’s research on this topic: http://mindlesseating.org/.

The US spends billions on agricultural subsidies, which distort the market for agricultural goods, specifically commodity grains which are storable, convertible into products, and useful for animal feed. In 2009, the US spent 4 billion USD on corn subsidies alone, and nearly all of that corn was converted to corn syrup, ethanol for fuel, or used for animal feed. These subsidies can constitute half a farmer’s income, as the fair market price of corn is deflated by the sheer volume produced. On the international scene, these subsidies depress the cost of American grains, injuring farmers abroad and damaging developing nations’ economies.

To use all of this grain and derivatives, new food products and new formulations of familiar ones have been engineered. The Twinkie™ is the standard bearer of packaged food products. Contrary to urban legend, it’s just an engineered cake with a designed shelf life of 25 days. Twinkies are made of things one would expect, like flour, water, butter–and things which are a little surprising, like petrochemicals and processed phosphate rock.

The changes in the American diet may has a metabolic dimension: fructose is metabolized differently than glucose or sucrose (a glucose bound to a fructose molecule), and this may have metabolic effects. See this presentation by Robert Lustig, MD at UCSD for a theory of the impact of high fructose intake. An April 13 NY Times article discusses Lustig’s take on fructose metabolism being a major cause of the increase in diabetes and weight gain. We’re certainly eating a lot more sugar, and a lot more of it is high fructose corn syrup—an average of 42.8 pounds more sugar per year compared to the 1950s, and 42% of it is now HFCS (mostly 55% fructose/45% glucose).

All this sugar is just one component of the greater amount we’re eating, which leads to there being a greater amount of us—and a greater number of us with diabetes type 2.

What it means

All of this adds up to a public health disaster—a loss of longevity, a reversal of the hard-won gains in life expectancy.

The mean life expectancy of current generations (Baby Boom, Gen-X, Gen-Y, Millenials) may actually decrease, relative to predicted increases, as a result of the prevalence of obesity and attendant health effects. The graphic above shows the predicted longevity of a 65-year-old woman. In 2010, she would have a predicted 19.3 more years, in 2050, 21.7 years—but with the effects of increased prevalence of diabetes, and heart disease related to obesity, she could lose 1/3 to 1 year of that predicted gain. This is a terribly disturbing conclusion: gains in life expectancy may slow or potentially reverse, as a result of lifestyle disease—fuelled by a food system designed around profit and special-interest benefits, not the public good.

What to do?

There are plenty of good ideas about what to do. Taking a systems approach, we need to restructure the agriculture subsidies. It’s poor policy to promote growing mountains of corn so vast that new ‘sinks’ have to be developed to use it, it’s unethical to spend taxpayer money to market full-fat cheese at the same time a different department of the same agency is fighting the increase in calorie density of foods and the size of restaurant portions. Restructuring the Department of Agriculture would be a good idea. Changing our diet is a top-down and bottom-up proposition. Access to reasonably priced, healthy foods (fruits, vegetables, legumes, whole grains) is necessary, and many areas this access is not adequate—and in many cases people who can eat well, don’t as a result of preferences. These preferences can be changed as a result of greater exposure and conscious and non-conscious behavior change.

The measure of the (washing) machine

Measuring the water use of a washing machine isn’t so hard, unless you have to do it unattended, silently, repeatedly, and do more than one machine at a time with one datalogger.

To tell what’s going on I need to know three things:

  1. How much hot water is used in a cycle?
  2. How much cold water is used in a cycle?
  3. When does the cycle start and end?  —so I can disaggregate individual cycles.

For (1) and (2), I’m using two Koolance flowmeters (see previous post). For (3), I’m using an electret microphone to detect the vibrations from the motor inside. Tom Igoe was very prescient in advising me to positively measure the activity of the machine, and Eric Rosenthal, Electronics Genius, was a great help in doing it in an elegant, low cost fashion (accelerometers are expensive, and tilt switches may not be as sensitive as I’d like).

The whole assembly is less than $1.00, (aside from the Arduino microcontroller) and the sensitivity can be tuned based on the resistance of the resistors.