Datsurfer
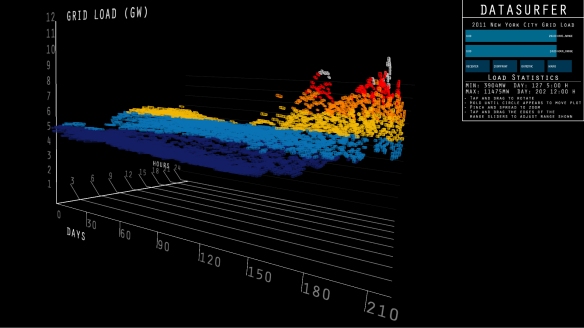
Datasurfer is a four-dimensional surface plot developed in Processing, for Introduction to Computational Media. Datasurfer takes a two-dimensional spreadsheet (CSV) and translates values into a 3D surface, which can be manipulated by moving the viewpoint, or by shrinking or growing a two-dimensional window (in the case of the NYISO Grid Data, hours of the day/days of the year) of which blocks are plotted. Moving the viewpoint changes the apparent representation of the data, allowing for a wider set of conclusions to be made–in this case, it is easy to see that there is substantial variation in the load both over the course of the year, and over the course of the day.
Components
The processing sketch is based on a two-dimensional parsing algorithm from Jonathan Cousins and Nick Sears, and adapted with help from Zannah Marsh. The interface buttons and sliders come from the spectacular plugin set ControlP5, and the 3-D manipulation is provided by PeasyCam (much easier than writing my own manipulation with the Processing Camera commands). Of course, neither ControlP5 nor PeasyCam are perfect, but they do work quite well. A special thanks is due to Andreas Schlegel, author of ControlP5, for modifying the library to allow for changing the slider edge width – right when I needed it at the Ebay Design Expo.
At the ITP show, this is being displayed on a giant touchscreen, which is really a lot of fun, but unfortunately is a little hard to manipulate due to being only single-touch. Multitouch (which everyone loves on tablets, phones, and now laptops) is going to really extend the computing experience, much more than it has already.
Expansion
As a programmable interface, there is nearly infinite ability for customization of the tool to different datasets–half the work of information visualization is setting up the tool in such a way as to yield valid conclusions and minimize artifacts. One of the goals of this project is to build a real-time interface for data from a feed, such as a Tweet-A-Watt.
Special Thanks
Thanks to Jonathan Cousins and Nick Sears for a great fall introduction to information visualization and the seed of this project (and the start of the code), Zannah Marsh for the opportunity (need) to develop this for ICM, the Processing community for developing great plugins (ControlP5, PeasyCam), and of course ITP (specifically George Agudow and Red Burns).


Pingback: The Technoverse Blog | NYU ITP Spring Show 2011: Apps at at Exhibition |
Pingback: Technoverse Blog | NYU ITP Spring Show 2011: Apps at at Exhibition